
Note
Go to the end to download the full example code.
Building a lmfit model with SymPy
SymPy is a Python library for symbolic mathematics. It can be very useful to build a model with SymPy and then apply that model to the data with lmfit. This example shows how to do that. Please note that this example requires both the sympy and matplotlib packages.
import matplotlib.pyplot as plt
import numpy as np
import sympy
from sympy.parsing import sympy_parser

import lmfit
Instead of creating the SymPy symbols explicitly and building an expression with them, we will use the SymPy parser.
gauss_peak1 = sympy_parser.parse_expr('A1*exp(-(x-xc1)**2/(2*sigma1**2))')
gauss_peak2 = sympy_parser.parse_expr('A2*exp(-(x-xc2)**2/(2*sigma2**2))')
exp_back = sympy_parser.parse_expr('B*exp(-x/xw)')

model_list = sympy.Array((gauss_peak1, gauss_peak2, exp_back))
model = sum(model_list)
We are using SymPy’s lambdify function to make a function from the model expressions. We then use these functions to generate some fake data.
model_list_func = sympy.lambdify(list(model_list.free_symbols), model_list)
model_func = sympy.lambdify(list(model.free_symbols), model)
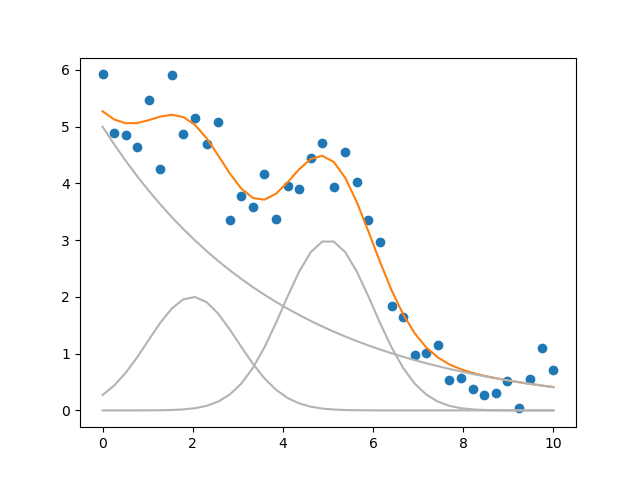
Generate synthetic data with noise and plot the data.
np.random.seed(1)
x = np.linspace(0, 10, 40)
param_values = dict(x=x, A1=2, sigma1=1, sigma2=1, A2=3, xc1=2, xc2=5, xw=4, B=5)
y = model_func(**param_values)
yi = model_list_func(**param_values)
yn = y + np.random.randn(y.size)*0.4

plt.plot(x, yn, 'o')
plt.plot(x, y)
for c in yi:
    plt.plot(x, c, color='0.7')
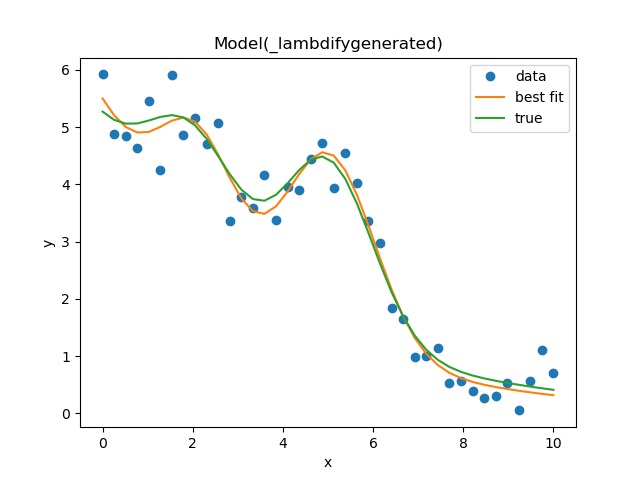
Next, we will just create a lmfit model from the function and fit the data.
lm_mod = lmfit.Model(model_func, independent_vars=('x',))
res = lm_mod.fit(data=yn, **param_values)
res.plot_fit()
plt.plot(x, y, label='true')
plt.legend()
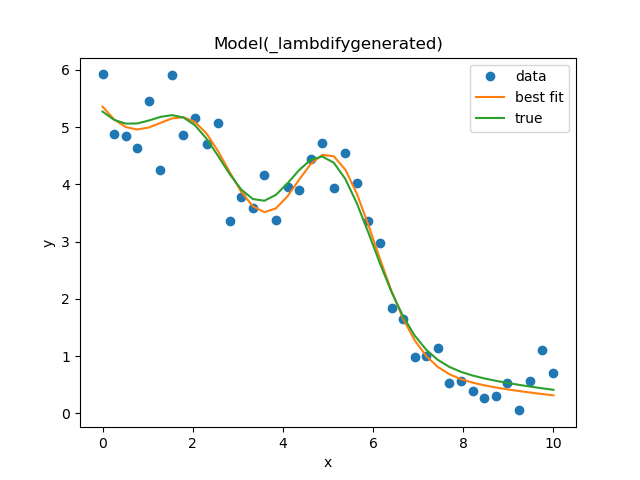
The nice thing of using SymPy is that we can easily modify our fit function. Let’s assume we know that the width of both Gaussians are identical. Similarly, we assume that the ratio between both Gaussians is fixed to 3:2 for some reason. Both can be expressed by just substituting the variables.
model2 = model.subs('sigma2', 'sigma1').subs('A2', '3/2*A1')
model2_func = sympy.lambdify(list(model2.free_symbols), model2)
lm_mod = lmfit.Model(model2_func, independent_vars=('x',))
param2_values = dict(x=x, A1=2, sigma1=1, xc1=2, xc2=5, xw=4, B=5)
res2 = lm_mod.fit(data=yn, **param2_values)
res2.plot_fit()
plt.plot(x, y, label='true')
plt.legend()
plt.show()
Total running time of the script: (0 minutes 1.317 seconds)