
Note
Go to the end to download the full example code.
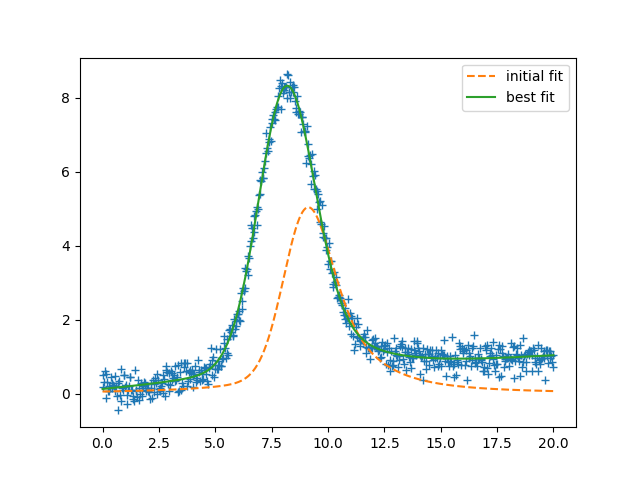
Fit with Algebraic Constraint
Example on how to use algebraic constraints using the expr attribute.
import matplotlib.pyplot as plt
from numpy import linspace, random

from lmfit.lineshapes import gaussian, lorentzian
from lmfit.models import GaussianModel, LinearModel, LorentzianModel

random.seed(0)
x = linspace(0.0, 20.0, 601)

data = (gaussian(x, amplitude=21, center=8.1, sigma=1.2) +
        lorentzian(x, amplitude=10, center=9.6, sigma=2.4) +
        0.01 + x*0.05 + random.normal(scale=0.23, size=x.size))


model = GaussianModel(prefix='g_') + LorentzianModel(prefix='l_') + LinearModel(prefix='line_')

params = model.make_params(g_amplitude=10, g_center=9, g_sigma=1,
                           line_slope=0, line_intercept=0)

params.add(name='total_amplitude', value=20)
params.set(l_amplitude=dict(expr='total_amplitude - g_amplitude'))
params.set(l_center=dict(expr='1.5+g_center'))
params.set(l_sigma=dict(expr='2*g_sigma'))


data_uncertainty = 0.021  # estimate of data error (for all data points)

init = model.eval(params, x=x)
result = model.fit(data, params, x=x, weights=1.0/data_uncertainty)

print(result.fit_report())

plt.plot(x, data, '+')
plt.plot(x, init, '--', label='initial fit')
plt.plot(x, result.best_fit, '-', label='best fit')
plt.legend()
plt.show()
[[Model]]
    ((Model(gaussian, prefix='g_') + Model(lorentzian, prefix='l_')) + Model(linear, prefix='line_'))
[[Fit Statistics]]
    # fitting method   = leastsq
    # function evals   = 65
    # data points      = 601
    # variables        = 6
    chi-square         = 71878.3055
    reduced chi-square = 120.803875
    Akaike info crit   = 2887.26503
    Bayesian info crit = 2913.65660
    R-squared          = 0.98977025
[[Variables]]
    g_amplitude:      21.1877635 +/- 0.32192128 (1.52%) (init = 10)
    g_center:         8.11125903 +/- 0.01162987 (0.14%) (init = 9)
    g_sigma:          1.20925819 +/- 0.01170853 (0.97%) (init = 1)
    l_amplitude:      9.41261441 +/- 0.61672968 (6.55%) == 'total_amplitude - g_amplitude'
    l_center:         9.61125903 +/- 0.01162987 (0.12%) == '1.5+g_center'
    l_sigma:          2.41851637 +/- 0.02341707 (0.97%) == '2*g_sigma'
    line_slope:       0.04615727 +/- 0.00170178 (3.69%) (init = 0)
    line_intercept:   0.05128584 +/- 0.02448063 (47.73%) (init = 0)
    g_fwhm:           2.84758536 +/- 0.02757149 (0.97%) == '2.3548200*g_sigma'
    g_height:         6.98998378 +/- 0.05837066 (0.84%) == '0.3989423*g_amplitude/max(1e-15, g_sigma)'
    l_fwhm:           4.83703275 +/- 0.04683414 (0.97%) == '2.0000000*l_sigma'
    l_height:         1.23882905 +/- 0.08992735 (7.26%) == '0.3183099*l_amplitude/max(1e-15, l_sigma)'
    total_amplitude:  30.6003779 +/- 0.36481425 (1.19%) (init = 20)
[[Correlations]] (unreported correlations are < 0.100)
    C(g_amplitude, g_sigma)            = +0.8662
    C(g_amplitude, g_center)           = +0.7496
    C(line_slope, line_intercept)      = -0.7144
    C(g_center, total_amplitude)       = -0.6952
    C(g_center, g_sigma)               = +0.6227
    C(g_amplitude, total_amplitude)    = -0.6115
    C(line_intercept, total_amplitude) = -0.5883
    C(g_sigma, total_amplitude)        = -0.4115
    C(g_center, line_intercept)        = +0.3868
    C(g_amplitude, line_intercept)     = +0.1834
    C(g_amplitude, line_slope)         = +0.1825
    C(g_sigma, line_slope)             = +0.1739
Total running time of the script: (0 minutes 0.332 seconds)