
Note
Go to the end to download the full example code.
Outlier detection via leave-one-out
Outliers can sometimes be identified by assessing the influence of each datapoint. To assess the influence of one point, we fit the dataset without the point and compare the result with the fit of the full dataset. The code below shows how to do this with lmfit. Note that the presented method is very basic.
from collections import defaultdict

import matplotlib.pyplot as plt
import numpy as np

import lmfit
Generate test data and model:
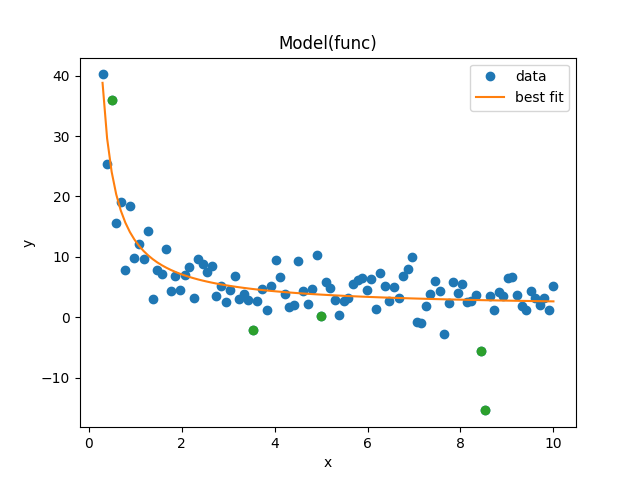
x = np.linspace(0.3, 10, 100)
np.random.seed(1)
y = 1.0 / (0.1 * x) + 2.0 + 3 * np.random.randn(x.size)

params = lmfit.Parameters()
params.add_many(('a', 0.1), ('b', 1))


def func(x, a, b):
    return 1.0 / (a * x) + b
Make five points outliers:
idx = np.random.randint(0, x.size, 5)
y[idx] += 10 * np.random.randn(idx.size)
Fit the data:
and gives the plot and fitting results below:
print(fit_result.fit_report())
[[Model]]
    Model(func)
[[Fit Statistics]]
    # fitting method   = leastsq
    # function evals   = 13
    # data points      = 100
    # variables        = 2
    chi-square         = 1338.34458
    reduced chi-square = 13.6565773
    Akaike info crit   = 263.401856
    Bayesian info crit = 268.612196
    R-squared          = 0.70062332
[[Variables]]
    a:  0.08937623 +/- 0.00590174 (6.60%) (init = 0.1)
    b:  1.51298991 +/- 0.46229147 (30.55%) (init = 2)
[[Correlations]] (unreported correlations are < 0.100)
    C(a, b) = +0.6008
Fit the dataset while omitting one data point:
best_vals = defaultdict(lambda: np.zeros(x.size))
stderrs = defaultdict(lambda: np.zeros(x.size))
chi_sq = np.zeros_like(x)
for i in range(x.size):
    idx2 = np.arange(0, x.size)
    idx2 = np.delete(idx2, i)
    tmp_x = x[idx2]
    tmp = model.fit(y[idx2], x=tmp_x, a=fit_result.params['a'],
                    b=fit_result.params['b'])
    chi_sq[i] = tmp.chisqr
    for p in tmp.params:
        tpar = tmp.params[p]
        best_vals[p][i] = tpar.value
        stderrs[p][i] = (tpar.stderr / fit_result.params[p].stderr)
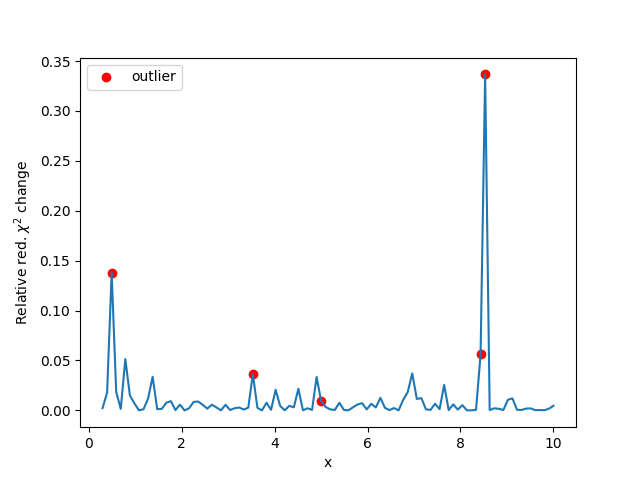
Plot the influence on the red. chisqr of each point:
fig, ax = plt.subplots()
ax.plot(x, (fit_result.chisqr - chi_sq) / chi_sq)
ax.scatter(x[idx], fit_result.chisqr / chi_sq[idx] - 1, color='r',
           label='outlier')
ax.set_ylabel(r'Relative red. $\chi^2$ change')
ax.set_xlabel('x')
ax.legend()
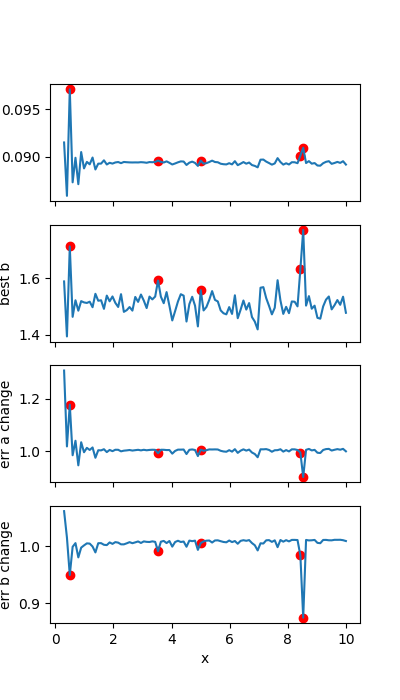
Plot the influence on the parameter value and error of each point:
fig, axs = plt.subplots(4, figsize=(4, 7), sharex='col')
axs[0].plot(x, best_vals['a'])
axs[0].scatter(x[idx], best_vals['a'][idx], color='r', label='outlier')
axs[0].set_ylabel('best a')

axs[1].plot(x, best_vals['b'])
axs[1].scatter(x[idx], best_vals['b'][idx], color='r', label='outlier')
axs[1].set_ylabel('best b')

axs[2].plot(x, stderrs['a'])
axs[2].scatter(x[idx], stderrs['a'][idx], color='r', label='outlier')
axs[2].set_ylabel('err a change')

axs[3].plot(x, stderrs['b'])
axs[3].scatter(x[idx], stderrs['b'][idx], color='r', label='outlier')
axs[3].set_ylabel('err b change')

axs[3].set_xlabel('x')
Total running time of the script: (0 minutes 1.353 seconds)