
Note
Go to the end to download the full example code.
Model - uncertainty
[[Model]]
    Model(gaussian)
[[Fit Statistics]]
    # fitting method   = leastsq
    # function evals   = 33
    # data points      = 101
    # variables        = 3
    chi-square         = 3.40883599
    reduced chi-square = 0.03478404
    Akaike info crit   = -336.263713
    Bayesian info crit = -328.418352
    R-squared          = 0.98533348
[[Variables]]
    amp:  8.88021893 +/- 0.11359522 (1.28%) (init = 5)
    cen:  5.65866102 +/- 0.01030495 (0.18%) (init = 5)
    wid:  0.69765478 +/- 0.01030505 (1.48%) (init = 1)
[[Correlations]] (unreported correlations are < 0.100)
    C(amp, wid) = +0.5774
# <examples/doc_model_uncertainty.py>
import matplotlib.pyplot as plt
from numpy import exp, loadtxt, pi, sqrt
from lmfit import Model
data = loadtxt('model1d_gauss.dat')
x = data[:, 0]
y = data[:, 1]
def gaussian(x, amp, cen, wid):
"""1-d gaussian: gaussian(x, amp, cen, wid)"""
return (amp / (sqrt(2*pi) * wid)) * exp(-(x-cen)**2 / (2*wid**2))
gmodel = Model(gaussian)
result = gmodel.fit(y, x=x, amp=5, cen=5, wid=1)
print(result.fit_report())
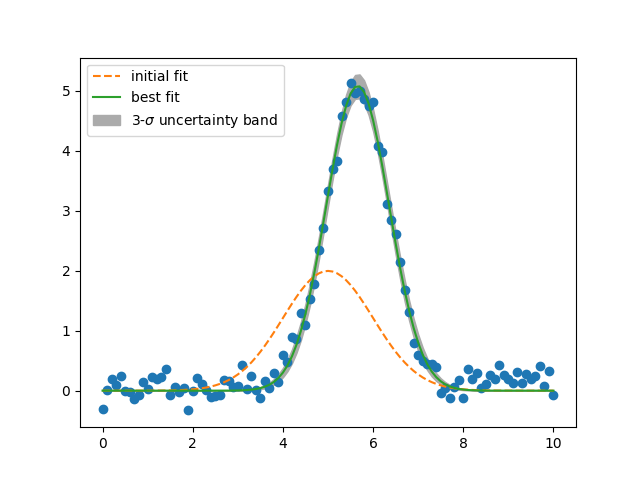
dely = result.eval_uncertainty(sigma=3)
plt.plot(x, y, 'o')
plt.plot(x, result.init_fit, '--', label='initial fit')
plt.plot(x, result.best_fit, '-', label='best fit')
plt.fill_between(x, result.best_fit-dely, result.best_fit+dely,
color="#ABABAB", label=r'3-$\sigma$ uncertainty band')
plt.legend()
plt.show()
# <end examples/doc_model_uncertainty.py>
Total running time of the script: (0 minutes 0.307 seconds)