Note
Go to the end to download the full example code.
Fitting - emcee
[[Variables]]
    a1:  2.98623689 +/- 0.15010519 (5.03%) (init = 4)
    a2: -4.33525597 +/- 0.11765824 (2.71%) (init = 4)
    t1:  1.30993186 +/- 0.13449656 (10.27%) (init = 3)
    t2:  11.8240752 +/- 0.47172610 (3.99%) (init = 3)
[[Correlations]] (unreported correlations are < 0.500)
    C(a2, t2) = +0.9876
    C(a2, t1) = -0.9278
    C(t1, t2) = -0.8852
    C(a1, t1) = -0.6093
The chain is shorter than 50 times the integrated autocorrelation time for 5 parameter(s). Use this estimate with caution and run a longer chain!
N/50 = 20;
tau: [42.15955322 47.347426   48.71211873 46.7985718  40.89881208]

median of posterior probability distribution
--------------------------------------------
[[Variables]]
    a1:         2.98945718 +/- 0.14033921 (4.69%) (init = 2.986237)
    a2:        -4.34687243 +/- 0.12131092 (2.79%) (init = -4.335256)
    t1:         1.32883916 +/- 0.13766047 (10.36%) (init = 1.309932)
    t2:         11.7836194 +/- 0.47719763 (4.05%) (init = 11.82408)
    __lnsigma: -2.32559226 +/- 0.04542650 (1.95%) (init = -2.302585)
[[Correlations]] (unreported correlations are < 0.100)
    C(a2, t2) = +0.9811
    C(a2, t1) = -0.9377
    C(t1, t2) = -0.8943
    C(a1, t1) = -0.5076
    C(a1, a2) = +0.2140
    C(a1, t2) = +0.1777

Maximum Likelihood Estimation from emcee
-------------------------------------------------
Parameter  MLE Value   Median Value   Uncertainty
  a1         2.93839     2.98946       0.14034
  a2        -4.35274    -4.34687       0.12131
  t1         1.34310     1.32884       0.13766
  t2        11.78782    11.78362       0.47720

Error Estimates from emcee
------------------------------------------------------
Parameter  -2sigma  -1sigma   median  +1sigma  +2sigma
  a1       -0.2656  -0.1362   2.9895   0.1445   0.3141
  a2       -0.3209  -0.1309  -4.3469   0.1118   0.1985
  t1       -0.2377  -0.1305   1.3288   0.1448   0.3278
  t2       -1.0677  -0.4807  11.7836   0.4739   0.8990
# <examples/doc_fitting_emcee.py>
import numpy as np

import lmfit

try:
    import matplotlib.pyplot as plt
    HASPYLAB = True
except ImportError:
    HASPYLAB = False

try:
    import corner
    HASCORNER = True
except ImportError:
    HASCORNER = False

x = np.linspace(1, 10, 250)
np.random.seed(0)
y = (3.0*np.exp(-x/2) - 5.0*np.exp(-(x-0.1) / 10.) +
     0.1*np.random.randn(x.size))

p = lmfit.Parameters()
p.add_many(('a1', 4), ('a2', 4), ('t1', 3), ('t2', 3., True))


def residual(p):
    v = p.valuesdict()
    return v['a1']*np.exp(-x/v['t1']) + v['a2']*np.exp(-(x-0.1) / v['t2']) - y


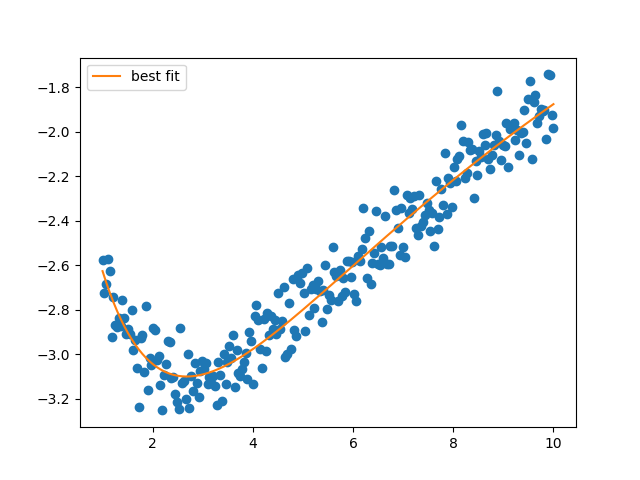
mi = lmfit.minimize(residual, p, method='nelder', nan_policy='omit')
lmfit.printfuncs.report_fit(mi.params, min_correl=0.5)
if HASPYLAB:
    plt.figure()
    plt.plot(x, y, 'o')
    plt.plot(x, residual(mi.params) + y, label='best fit')
    plt.legend()
    plt.show()

# Place bounds on the ln(sigma) parameter that emcee will automatically add
# to estimate the true uncertainty in the data since is_weighted=False
mi.params.add('__lnsigma', value=np.log(0.1), min=np.log(0.001), max=np.log(2))

res = lmfit.minimize(residual, method='emcee', nan_policy='omit', burn=300,
                     steps=1000, thin=20, params=mi.params, is_weighted=False,
                     progress=False)

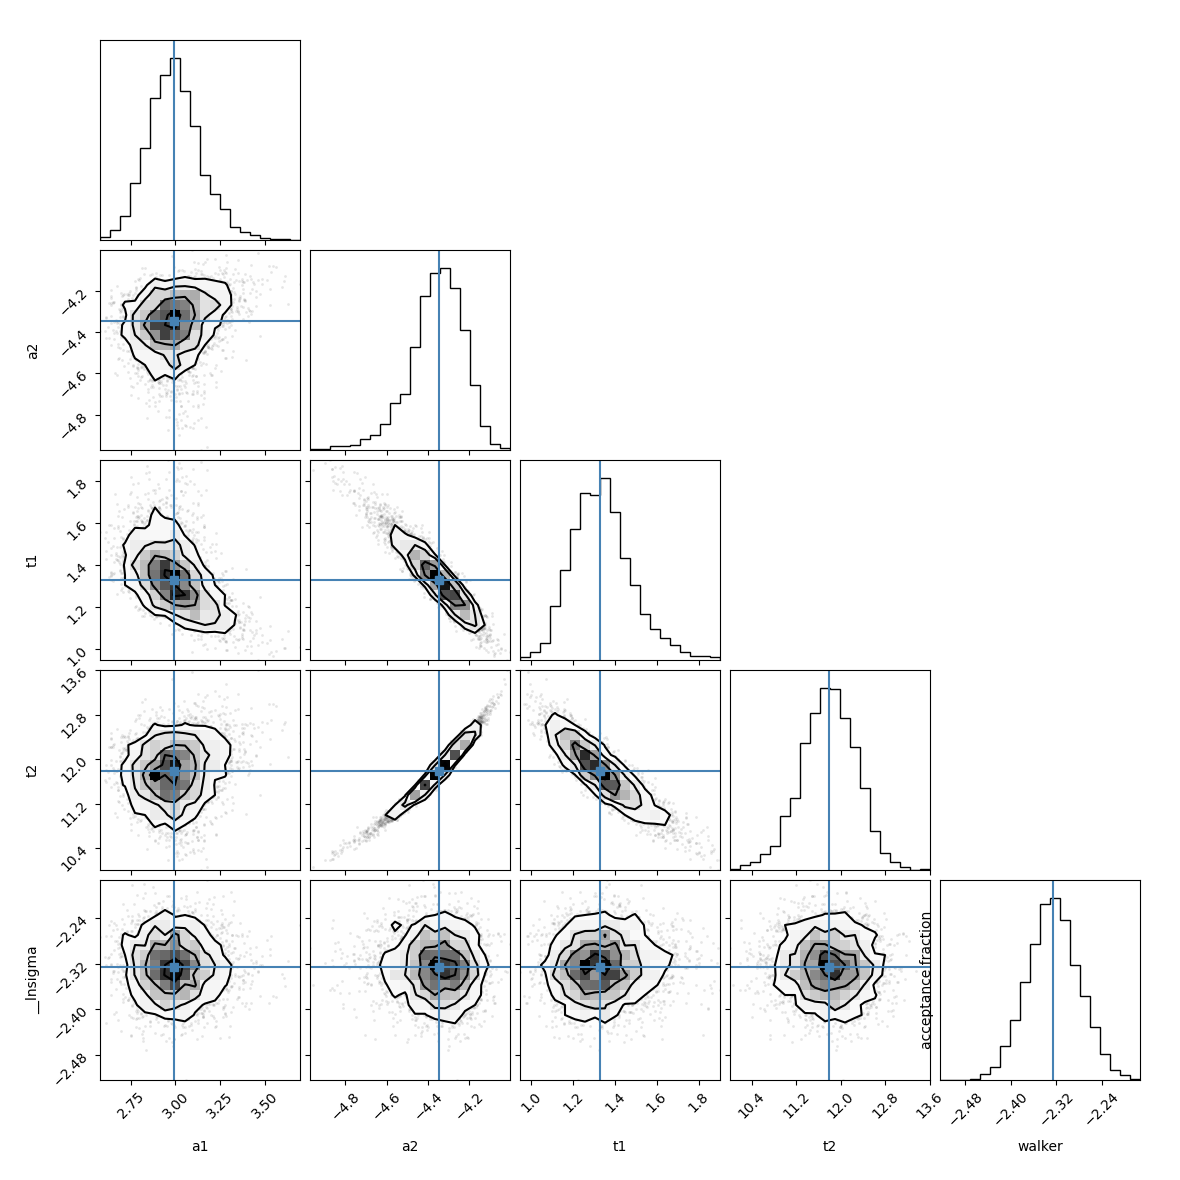
if HASPYLAB and HASCORNER:
    emcee_corner = corner.corner(res.flatchain, labels=res.var_names,
                                 truths=list(res.params.valuesdict().values()))
    plt.show()

if HASPYLAB:
    plt.plot(res.acceptance_fraction, 'o')
    plt.xlabel('walker')
    plt.ylabel('acceptance fraction')
    plt.show()

if hasattr(res, "acor"):
    print("Autocorrelation time for the parameters:")
    print("----------------------------------------")
    for i, par in enumerate(p):
        print(par, res.acor[i])

print("\nmedian of posterior probability distribution")
print('--------------------------------------------')
lmfit.report_fit(res.params)


# find the maximum likelihood solution
highest_prob = np.argmax(res.lnprob)
hp_loc = np.unravel_index(highest_prob, res.lnprob.shape)
mle_soln = res.chain[hp_loc]
for i, par in enumerate(p):
    p[par].value = mle_soln[i]

print('\nMaximum Likelihood Estimation from emcee       ')
print('-------------------------------------------------')
print('Parameter  MLE Value   Median Value   Uncertainty')
fmt = '  {:5s}  {:11.5f} {:11.5f}   {:11.5f}'.format
for name, param in p.items():
    print(fmt(name, param.value, res.params[name].value,
              res.params[name].stderr))

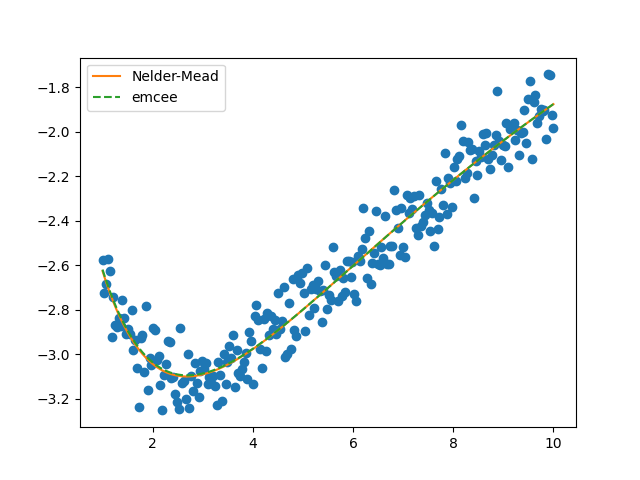
if HASPYLAB:
    plt.figure()
    plt.plot(x, y, 'o')
    plt.plot(x, residual(mi.params) + y, label='Nelder-Mead')
    plt.plot(x, residual(res.params) + y, '--', label='emcee')
    plt.legend()
    plt.show()

print('\nError Estimates from emcee    ')
print('------------------------------------------------------')
print('Parameter  -2sigma  -1sigma   median  +1sigma  +2sigma ')

for name in p.keys():
    quantiles = np.percentile(res.flatchain[name],
                              [2.275, 15.865, 50, 84.135, 97.275])
    median = quantiles[2]
    err_m2 = quantiles[0] - median
    err_m1 = quantiles[1] - median
    err_p1 = quantiles[3] - median
    err_p2 = quantiles[4] - median
    fmt = '  {:5s}   {:8.4f} {:8.4f} {:8.4f} {:8.4f} {:8.4f}'.format
    print(fmt(name, err_m2, err_m1, median, err_p1, err_p2))
Total running time of the script: (0 minutes 10.050 seconds)


