
Note
Go to the end to download the full example code.
Model - uncertainty2
[[Model]]
    ((Model(gaussian, prefix='g1_') + Model(gaussian, prefix='g2_')) + Model(exponential, prefix='bkg_'))
[[Fit Statistics]]
    # fitting method   = leastsq
    # function evals   = 55
    # data points      = 250
    # variables        = 8
    chi-square         = 1247.52821
    reduced chi-square = 5.15507524
    Akaike info crit   = 417.864631
    Bayesian info crit = 446.036318
    R-squared          = 0.99648654
[[Variables]]
    g1_amplitude:   4257.77399 +/- 42.3838008 (1.00%) (init = 3000)
    g1_center:      107.030957 +/- 0.15006868 (0.14%) (init = 100)
    g1_sigma:       16.6725789 +/- 0.16048222 (0.96%) (init = 10)
    g2_amplitude:   2493.41715 +/- 36.1696228 (1.45%) (init = 3000)
    g2_center:      153.270104 +/- 0.19466723 (0.13%) (init = 150)
    g2_sigma:       13.8069453 +/- 0.18680099 (1.35%) (init = 10)
    bkg_amplitude:  99.0183280 +/- 0.53748639 (0.54%) (init = 100)
    bkg_decay:      90.9508824 +/- 1.10310769 (1.21%) (init = 80)
    g1_fwhm:        39.2609222 +/- 0.37790675 (0.96%) == '2.3548200*g1_sigma'
    g1_height:      101.880228 +/- 0.59217122 (0.58%) == '0.3989423*g1_amplitude/max(1e-15, g1_sigma)'
    g2_fwhm:        32.5128710 +/- 0.43988270 (1.35%) == '2.3548200*g2_sigma'
    g2_height:      72.0455936 +/- 0.61721901 (0.86%) == '0.3989423*g2_amplitude/max(1e-15, g2_sigma)'
[[Correlations]] (unreported correlations are < 0.500)
    C(g1_amplitude, g1_sigma)   = +0.8243
    C(g2_amplitude, g2_sigma)   = +0.8154
    C(bkg_amplitude, bkg_decay) = -0.6946
    C(g1_sigma, g2_center)      = +0.6842
    C(g1_center, g2_amplitude)  = -0.6689
    C(g1_center, g2_sigma)      = -0.6520
    C(g1_amplitude, g2_center)  = +0.6477
    C(g1_center, g2_center)     = +0.6205
    C(g1_center, g1_sigma)      = +0.5075
    C(g1_amplitude, bkg_decay)  = -0.5074
# <examples/doc_model_uncertainty2.py>
import matplotlib.pyplot as plt
import numpy as np
from lmfit.models import ExponentialModel, GaussianModel
dat = np.loadtxt('NIST_Gauss2.dat')
x = dat[:, 1]
y = dat[:, 0]
model = (GaussianModel(prefix='g1_') +
GaussianModel(prefix='g2_') +
ExponentialModel(prefix='bkg_'))
params = model.make_params(bkg_amplitude=100, bkg_decay=80,
g1_amplitude=3000,
g1_center=100,
g1_sigma=10,
g2_amplitude=3000,
g2_center=150,
g2_sigma=10)
result = model.fit(y, params, x=x)
print(result.fit_report(min_correl=0.5))
comps = result.eval_components(x=x)
dely = result.eval_uncertainty(sigma=3)
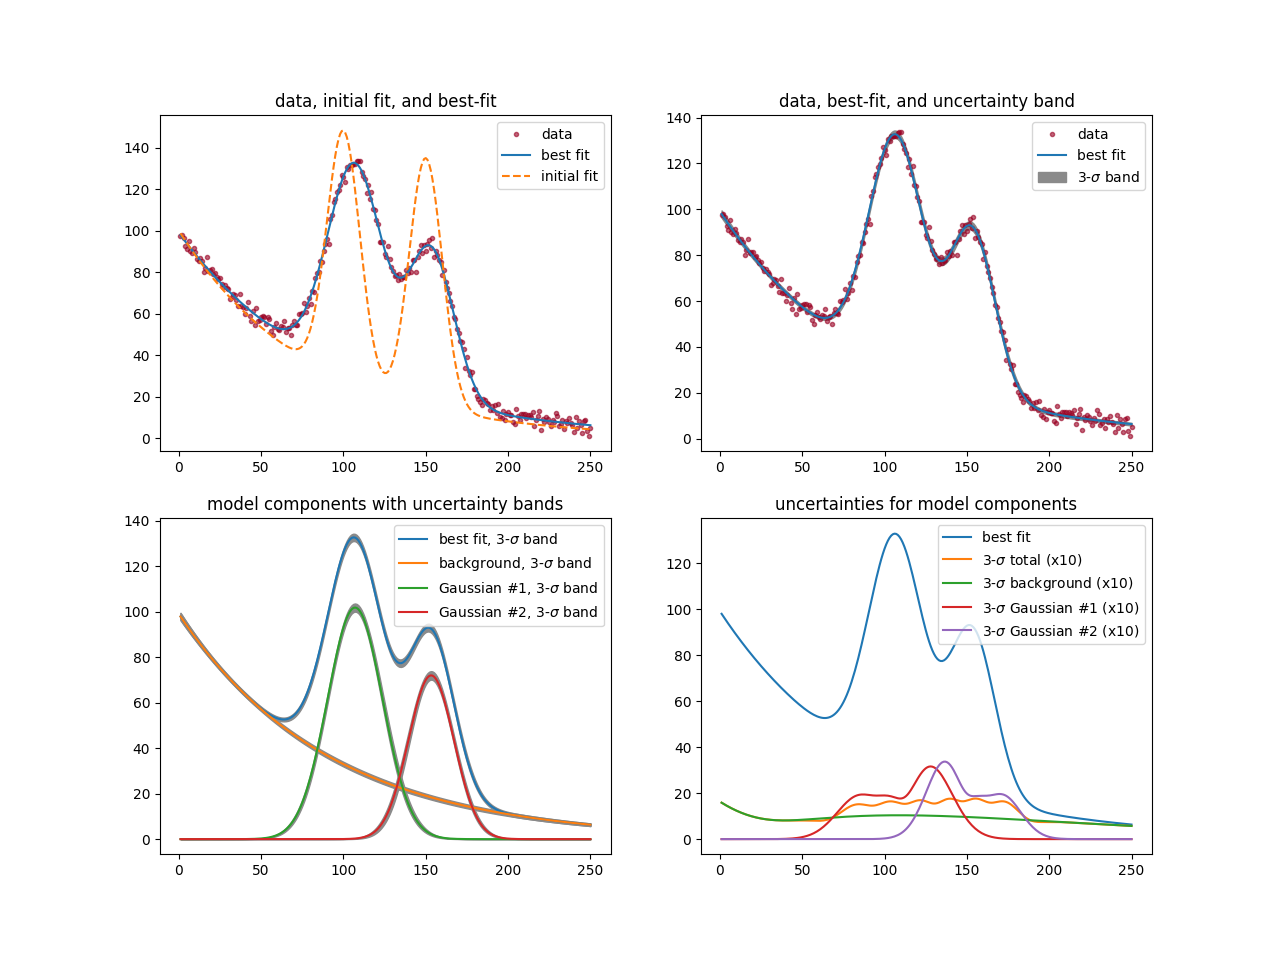
fig, axes = plt.subplots(2, 2, figsize=(12.8, 9.6))
axes[0][0].plot(x, y, 'o', color='#99002299', markersize=3, label='data')
axes[0][0].plot(x, result.best_fit, '-', label='best fit')
axes[0][0].plot(x, result.init_fit, '--', label='initial fit')
axes[0][0].set_title('data, initial fit, and best-fit')
axes[0][0].legend()
axes[0][1].plot(x, y, 'o', color='#99002299', markersize=3, label='data')
axes[0][1].plot(x, result.best_fit, '-', label='best fit')
axes[0][1].fill_between(x, result.best_fit-dely, result.best_fit+dely,
color="#8A8A8A", label=r'3-$\sigma$ band')
axes[0][1].set_title('data, best-fit, and uncertainty band')
axes[0][1].legend()
axes[1][0].plot(x, result.best_fit, '-', label=r'best fit, 3-$\sigma$ band')
axes[1][0].fill_between(x,
result.best_fit-result.dely,
result.best_fit+result.dely,
color="#8A8A8A")
axes[1][0].plot(x, comps['bkg_'], label=r'background, 3-$\sigma$ band')
axes[1][0].fill_between(x,
comps['bkg_']-result.dely_comps['bkg_'],
comps['bkg_']+result.dely_comps['bkg_'],
color="#8A8A8A")
axes[1][0].plot(x, comps['g1_'], label=r'Gaussian #1, 3-$\sigma$ band')
axes[1][0].fill_between(x,
comps['g1_']-result.dely_comps['g1_'],
comps['g1_']+result.dely_comps['g1_'],
color="#8A8A8A")
axes[1][0].plot(x, comps['g2_'], label=r'Gaussian #2, 3-$\sigma$ band')
axes[1][0].fill_between(x,
comps['g2_']-result.dely_comps['g2_'],
comps['g2_']+result.dely_comps['g2_'],
color="#8A8A8A")
axes[1][0].set_title('model components with uncertainty bands')
axes[1][0].legend()
axes[1][1].plot(x, result.best_fit, '-', label='best fit')
axes[1][1].plot(x, 10*result.dely, label=r'3-$\sigma$ total (x10)')
axes[1][1].plot(x, 10*result.dely_comps['bkg_'], label=r'3-$\sigma$ background (x10)')
axes[1][1].plot(x, 10*result.dely_comps['g1_'], label=r'3-$\sigma$ Gaussian #1 (x10)')
axes[1][1].plot(x, 10*result.dely_comps['g2_'], label=r'3-$\sigma$ Gaussian #2 (x10)')
axes[1][1].set_title('uncertainties for model components')
axes[1][1].legend()
plt.show()
# <end examples/doc_model_uncertainty2.py>
Total running time of the script: (0 minutes 1.359 seconds)