
Note
Go to the end to download the full example code.
Confidence - chi2 maps
# <examples/doc_confidence_chi2_maps.py>

import matplotlib.pyplot as plt
import numpy as np

from lmfit import conf_interval, conf_interval2d, report_ci
from lmfit.lineshapes import gaussian
from lmfit.models import GaussianModel, LinearModel

sigma_levels = [1, 2, 3]

rng = np.random.default_rng(seed=102)
set up data – deliberately adding imperfections and a small amount of non-Gaussian noise
npts = 501
x = np.linspace(1, 100, num=npts)

noise = rng.normal(scale=0.3, size=npts) + 0.2*rng.f(3, 9, size=npts)

y = (gaussian(x, amplitude=83, center=47., sigma=5.)
     + 0.02*x + 4 + 0.25*np.cos((x-20)/8.0) + noise)

mod = GaussianModel() + LinearModel()
params = mod.make_params(amplitude=100, center=50, sigma=5,
                         slope=0, intecept=2)

out = mod.fit(y, params, x=x)
print(out.fit_report(correl_mode='table'))
[[Model]]
    (Model(gaussian) + Model(linear))
[[Fit Statistics]]
    # fitting method   = leastsq
    # function evals   = 31
    # data points      = 501
    # variables        = 5
    chi-square         = 103.861381
    reduced chi-square = 0.20939794
    Akaike info crit   = -778.348033
    Bayesian info crit = -757.265003
    R-squared          = 0.93782756
[[Variables]]
    amplitude:  78.8171374 +/- 1.21910939 (1.55%) (init = 100)
    center:     47.0751649 +/- 0.07576660 (0.16%) (init = 50)
    sigma:      4.93298753 +/- 0.07984021 (1.62%) (init = 5)
    slope:      0.01839006 +/- 7.1957e-04 (3.91%) (init = 0)
    intercept:  4.39234411 +/- 0.04420227 (1.01%) (init = 0)
    fwhm:       11.6162977 +/- 0.18800933 (1.62%) == '2.3548200*sigma'
    height:     6.37412722 +/- 0.08603873 (1.35%) == '0.3989423*amplitude/max(1e-15, sigma)'
[[Correlations]]
  +-----------+-----------+-----------+-----------+-----------+-----------+
  | Variable  | amplitude | center    | sigma     | slope     | intercept |
  +-----------+-----------+-----------+-----------+-----------+-----------+
  | amplitude | +1.0000   | -0.0074   | +0.6371   | +0.0721   | -0.3373   |
  | center    | -0.0074   | +1.0000   | -0.0048   | -0.1026   | +0.0864   |
  | sigma     | +0.6371   | -0.0048   | +1.0000   | +0.0459   | -0.2149   |
  | slope     | +0.0721   | -0.1026   | +0.0459   | +1.0000   | -0.8421   |
  | intercept | -0.3373   | +0.0864   | -0.2149   | -0.8421   | +1.0000   |
  +-----------+-----------+-----------+-----------+-----------+-----------+
run conf_intervale, print report
ci = conf_interval(out, out, sigmas=sigma_levels)

print("## Confidence Report:")
report_ci(ci)
## Confidence Report:
              99.73%    95.45%    68.27%    _BEST_    68.27%    95.45%    99.73%
 amplitude:  -3.62610  -2.41983  -1.21237  78.81714  +1.22111  +2.45479  +3.70515
 center   :  -0.22849  -0.15214  -0.07584  47.07516  +0.07587  +0.15225  +0.22873
 sigma    :  -0.23335  -0.15640  -0.07870   4.93299  +0.08000  +0.16158  +0.24509
 slope    :  -0.00217  -0.00144  -0.00072   0.01839  +0.00072  +0.00144  +0.00217
 intercept:  -0.13326  -0.08860  -0.04423   4.39234  +0.04421  +0.08854  +0.13312
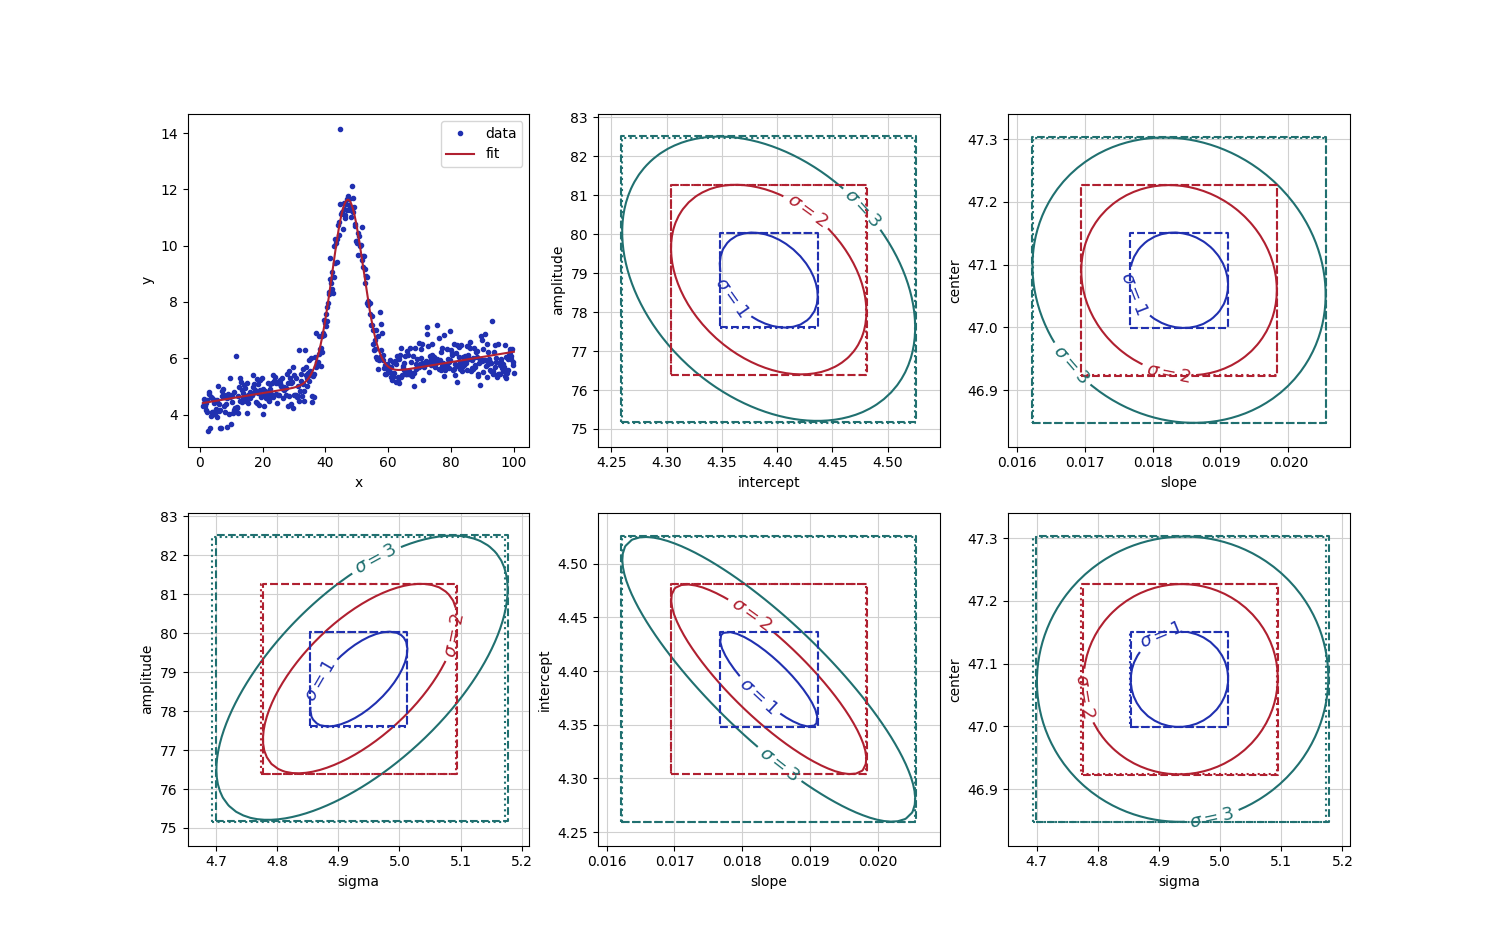
plot initial fit
colors = ('#2030b0', '#b02030', '#207070')
fig, axes = plt.subplots(2, 3, figsize=(15, 9.5))


axes[0, 0].plot(x, y, 'o', markersize=3, label='data', color=colors[0])
axes[0, 0].plot(x, out.best_fit, label='fit', color=colors[1])
axes[0, 0].set_xlabel('x')
axes[0, 0].set_ylabel('y')
axes[0, 0].legend()


aix, aiy = 0, 0
nsamples = 50
explicitly_calculate_sigma = True

for pairs in (('sigma', 'amplitude'), ('intercept', 'amplitude'),
              ('slope', 'intercept'), ('slope', 'center'), ('sigma', 'center')):

    xpar, ypar = pairs
    if explicitly_calculate_sigma:
        print(f"Generating chi-square map for {pairs}")
        c_x, c_y, chi2_mat = conf_interval2d(out, out, xpar, ypar,
                                             nsamples, nsamples, nsigma=3.5,
                                             chi2_out=True)
        # explicitly calculate sigma matrix: sigma increases chi_square
        # from  chi_square_best
        # to    chi_square + sigma**2 * reduced_chi_square
        # so:   sigma = sqrt((chi2-chi2_best)/ reduced_chi_square)
        chi2_min = chi2_mat.min()
        sigma_mat = np.sqrt((chi2_mat-chi2_min)/out.redchi)
    else:
        print(f"Generating sigma map for {pairs}")
        # or, you could just calculate the matrix of probabilities as:
        c_x, c_y, sigma_mat = conf_interval2d(out, out, xpar, ypar,
                                              nsamples, nsamples, nsigma=3.5)

    aix += 1
    if aix == 2:
        aix = 0
        aiy += 1
    ax = axes[aix, aiy]

    cnt = ax.contour(c_x, c_y, sigma_mat, levels=sigma_levels, colors=colors,
                     linestyles='-')
    ax.clabel(cnt, inline=True, fmt=r"$\sigma=%.0f$", fontsize=13)

    # draw boxes for estimated uncertaties:
    #  dotted :  scaled stderr from initial fit
    #  dashed :  values found from conf_interval()
    xv = out.params[xpar].value
    xs = out.params[xpar].stderr
    yv = out.params[ypar].value
    ys = out.params[ypar].stderr

    cix = ci[xpar]
    ciy = ci[ypar]

    nc = len(sigma_levels)
    for i in sigma_levels:
        # dotted line: scaled stderr
        ax.plot((xv-i*xs, xv+i*xs, xv+i*xs, xv-i*xs, xv-i*xs),
                (yv-i*ys, yv-i*ys, yv+i*ys, yv+i*ys, yv-i*ys),
                linestyle='dotted', color=colors[i-1])

        # dashed line: refined uncertainties from conf_interval
        xsp, xsm = cix[nc+i][1], cix[nc-i][1]
        ysp, ysm = ciy[nc+i][1], ciy[nc-i][1]
        ax.plot((xsm, xsp, xsp, xsm, xsm), (ysm, ysm, ysp, ysp, ysm),
                linestyle='dashed', color=colors[i-1])

    ax.set_xlabel(xpar)
    ax.set_ylabel(ypar)
    ax.grid(True, color='#d0d0d0')

plt.show()
# <end examples/doc_confidence_chi2_maps.py>
Generating chi-square map for ('sigma', 'amplitude')
Generating chi-square map for ('intercept', 'amplitude')
Generating chi-square map for ('slope', 'intercept')
Generating chi-square map for ('slope', 'center')
Generating chi-square map for ('sigma', 'center')
Total running time of the script: (0 minutes 46.032 seconds)