
Note
Go to the end to download the full example code.
Fit with Data in a pandas DataFrame
Simple example demonstrating how to read in the data using pandas and
supply the elements of the DataFrame to lmfit.
import pandas as pd

from lmfit.models import LorentzianModel
read the data into a pandas DataFrame, and use the x and y columns:
and gives the fitting results:
print(result.fit_report())
[[Model]]
    Model(lorentzian)
[[Fit Statistics]]
    # fitting method   = leastsq
    # function evals   = 21
    # data points      = 101
    # variables        = 3
    chi-square         = 13.0737250
    reduced chi-square = 0.13340536
    Akaike info crit   = -200.496119
    Bayesian info crit = -192.650757
    R-squared          = 0.98351484
[[Variables]]
    amplitude:  39.1530621 +/- 0.62389897 (1.59%) (init = 50.7825)
    center:     9.22379948 +/- 0.01835867 (0.20%) (init = 9.3)
    sigma:      1.15503770 +/- 0.02603721 (2.25%) (init = 1.3)
    fwhm:       2.31007541 +/- 0.05207442 (2.25%) == '2.0000000*sigma'
    height:     10.7899571 +/- 0.17160652 (1.59%) == '0.3183099*amplitude/max(1e-15, sigma)'
[[Correlations]] (unreported correlations are < 0.100)
    C(amplitude, sigma) = +0.7087
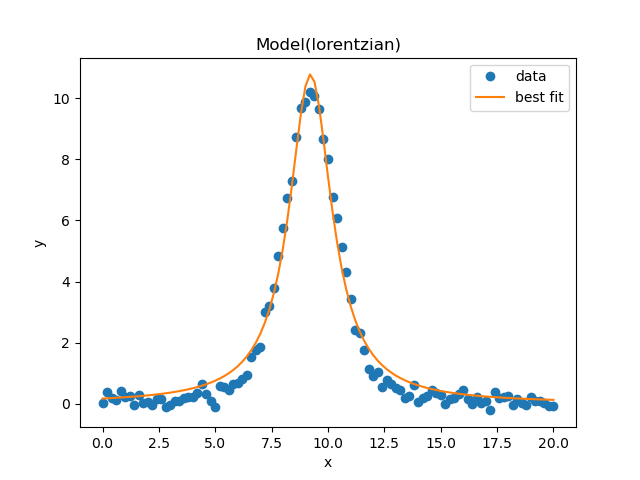
and plot below:
result.plot_fit()
Total running time of the script: (0 minutes 0.373 seconds)