
Note
Go to the end to download the full example code.
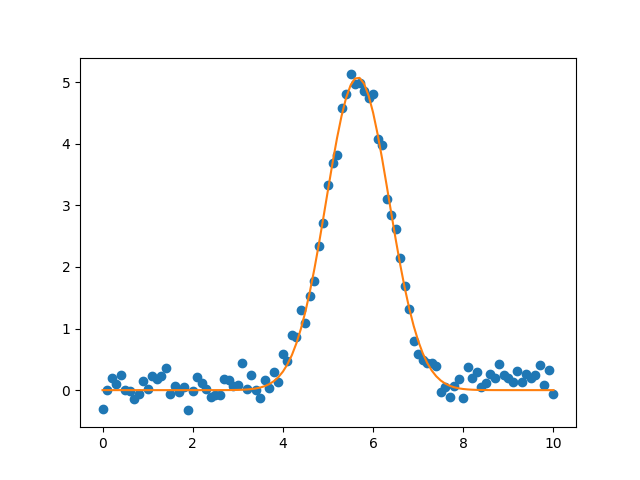
Model - loadmodelresult
[[Model]]
    Model(gaussian)
[[Fit Statistics]]
    # fitting method   = leastsq
    # function evals   = 33
    # data points      = 101
    # variables        = 3
    chi-square         = 3.40883599
    reduced chi-square = 0.03478404
    Akaike info crit   = -336.263713
    Bayesian info crit = -328.418352
    R-squared          = 0.98533348
[[Variables]]
    amplitude:  8.88021907 +/- 0.11359530 (1.28%) (init = 5)
    center:     5.65866105 +/- 0.01030493 (0.18%) (init = 5)
    sigma:      0.69765480 +/- 0.01030508 (1.48%) (init = 1)
    fwhm:       1.64285148 +/- 0.02426660 (1.48%) == '2.3548200*sigma'
    height:     5.07800563 +/- 0.06495769 (1.28%) == '0.3989423*amplitude/max(1e-15, sigma)'
[[Correlations]] (unreported correlations are < 0.100)
    C(amplitude, sigma) = +0.5774
# <examples/doc_model_loadmodelresult.py>
import os
import sys

import matplotlib.pyplot as plt
import numpy as np

from lmfit.model import load_modelresult

if not os.path.exists('gauss_modelresult.sav'):
    os.system(f"{sys.executable} doc_model_savemodelresult.py")

data = np.loadtxt('model1d_gauss.dat')
x = data[:, 0]
y = data[:, 1]

result = load_modelresult('gauss_modelresult.sav')
print(result.fit_report())

plt.plot(x, y, 'o')
plt.plot(x, result.best_fit, '-')
plt.show()
# <end examples/doc_model_loadmodelresult.py>
Total running time of the script: (0 minutes 0.276 seconds)