
Note
Go to the end to download the full example code.
Builtinmodels - peakmodels
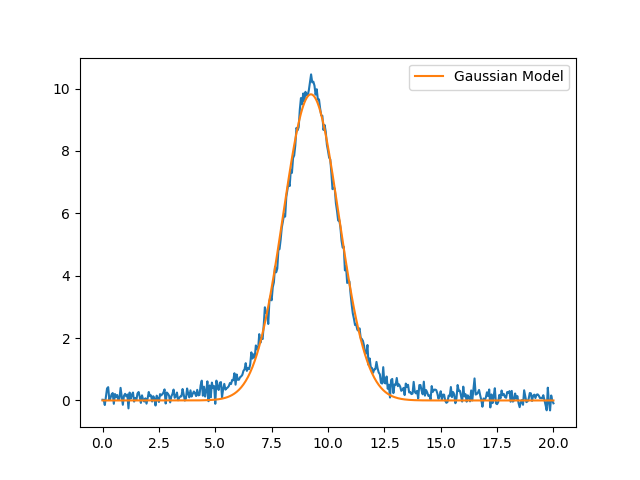
[[Model]]
Model(gaussian)
[[Fit Statistics]]
# fitting method = leastsq
# function evals = 25
# data points = 401
# variables = 3
chi-square = 29.9943157
reduced chi-square = 0.07536260
Akaike info crit = -1033.77437
Bayesian info crit = -1021.79248
R-squared = 0.99045513
[[Variables]]
amplitude: 30.3135789 +/- 0.15712752 (0.52%) (init = 43.62238)
center: 9.24277046 +/- 0.00737497 (0.08%) (init = 9.25)
sigma: 1.23218496 +/- 0.00737506 (0.60%) (init = 1.35)
fwhm: 2.90157379 +/- 0.01736695 (0.60%) == '2.3548200*sigma'
height: 9.81457271 +/- 0.05087308 (0.52%) == '0.3989423*amplitude/max(1e-15, sigma)'
[[Correlations]]
+-----------+-----------+-----------+-----------+
| Variable | amplitude | center | sigma |
+-----------+-----------+-----------+-----------+
| amplitude | +1.0000 | -0.0000 | +0.5774 |
| center | -0.0000 | +1.0000 | -0.0000 |
| sigma | +0.5774 | -0.0000 | +1.0000 |
+-----------+-----------+-----------+-----------+
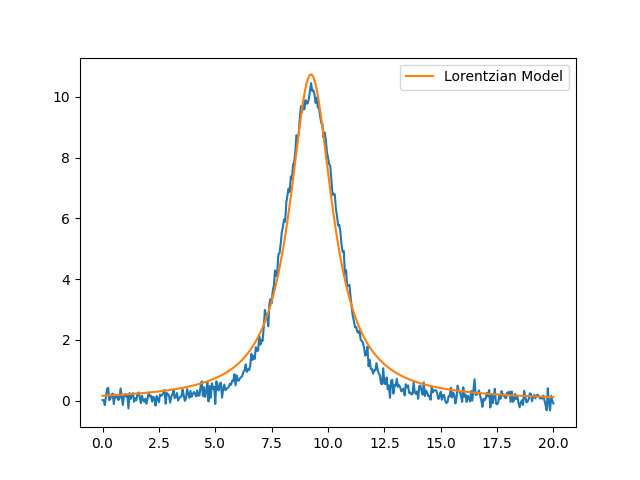
[[Model]]
Model(lorentzian)
[[Fit Statistics]]
# fitting method = leastsq
# function evals = 25
# data points = 401
# variables = 3
chi-square = 53.7535387
reduced chi-square = 0.13505914
Akaike info crit = -799.830322
Bayesian info crit = -787.848438
R-squared = 0.98289441
[[Variables]]
amplitude: 38.9726380 +/- 0.31386754 (0.81%) (init = 54.52798)
center: 9.24439393 +/- 0.00927645 (0.10%) (init = 9.25)
sigma: 1.15483177 +/- 0.01315708 (1.14%) (init = 1.35)
fwhm: 2.30966354 +/- 0.02631416 (1.14%) == '2.0000000*sigma'
height: 10.7421504 +/- 0.08634317 (0.80%) == '0.3183099*amplitude/max(1e-15, sigma)'
[[Correlations]]
+-----------+-----------+-----------+-----------+
| Variable | amplitude | center | sigma |
+-----------+-----------+-----------+-----------+
| amplitude | +1.0000 | -0.0002 | +0.7087 |
| center | -0.0002 | +1.0000 | -0.0002 |
| sigma | +0.7087 | -0.0002 | +1.0000 |
+-----------+-----------+-----------+-----------+
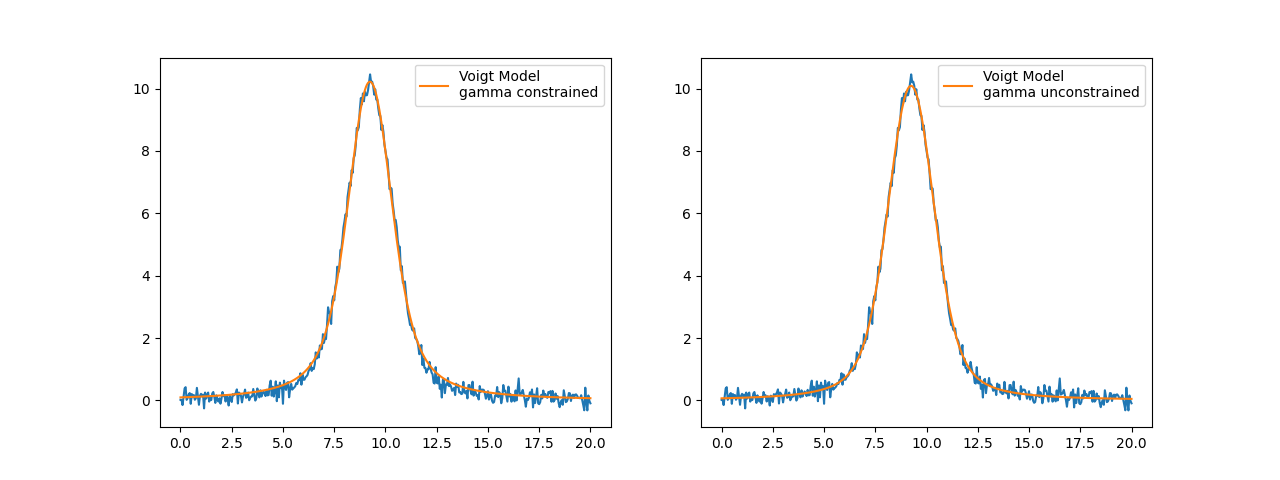
[[Model]]
Model(voigt)
[[Fit Statistics]]
# fitting method = leastsq
# function evals = 25
# data points = 401
# variables = 3
chi-square = 14.5448627
reduced chi-square = 0.03654488
Akaike info crit = -1324.00615
Bayesian info crit = -1312.02427
R-squared = 0.99537150
[[Variables]]
amplitude: 35.7553799 +/- 0.13861559 (0.39%) (init = 65.43358)
center: 9.24411179 +/- 0.00505496 (0.05%) (init = 9.25)
sigma: 0.73015485 +/- 0.00368473 (0.50%) (init = 0.8775)
gamma: 0.73015485 +/- 0.00368473 (0.50%) == 'sigma'
fwhm: 2.62949983 +/- 0.01326979 (0.50%) == '1.0692*gamma+sqrt(0.8664*gamma**2+5.545083*sigma**2)'
height: 10.2204068 +/- 0.03959933 (0.39%) == '(amplitude/(max(1e-15, sigma*sqrt(2*pi))))*real(wofz((1j*gamma)/(max(1e-15, sigma*sqrt(2)))))'
[[Correlations]]
+-----------+-----------+-----------+-----------+
| Variable | amplitude | center | sigma |
+-----------+-----------+-----------+-----------+
| amplitude | +1.0000 | -0.0001 | +0.6513 |
| center | -0.0001 | +1.0000 | -0.0001 |
| sigma | +0.6513 | -0.0001 | +1.0000 |
+-----------+-----------+-----------+-----------+
# <examples/doc_builtinmodels_peakmodels.py>
import matplotlib.pyplot as plt
from numpy import loadtxt

from lmfit.models import GaussianModel, LorentzianModel, VoigtModel

data = loadtxt('test_peak.dat')
x = data[:, 0]
y = data[:, 1]


# Gaussian model
mod = GaussianModel()
pars = mod.guess(y, x=x)
out = mod.fit(y, pars, x=x)

print(out.fit_report(correl_mode='table'))

plt.plot(x, y)
plt.plot(x, out.best_fit, '-', label='Gaussian Model')
plt.legend()
plt.show()


# Lorentzian model
mod = LorentzianModel()
pars = mod.guess(y, x=x)
out = mod.fit(y, pars, x=x)

print(out.fit_report(correl_mode='table'))

plt.figure()
plt.plot(x, y, '-')
plt.plot(x, out.best_fit, '-', label='Lorentzian Model')
plt.legend()
plt.show()


# Voigt model
mod = VoigtModel()
pars = mod.guess(y, x=x)
out = mod.fit(y, pars, x=x)

print(out.fit_report(correl_mode='table'))

fig, axes = plt.subplots(1, 2, figsize=(12.8, 4.8))

axes[0].plot(x, y, '-')
axes[0].plot(x, out.best_fit, '-', label='Voigt Model\ngamma constrained')
axes[0].legend()

# allow the gamma parameter to vary in the fit
pars['gamma'].vary = True
out_gamma = mod.fit(y, pars, x=x)
print(out.fit_report(correl_mode='table'))

axes[1].plot(x, y, '-')
axes[1].plot(x, out_gamma.best_fit, '-', label='Voigt Model\ngamma unconstrained')
axes[1].legend()

plt.show()
# <end examples/doc_builtinmodels_peakmodels.py>
Total running time of the script: (0 minutes 1.198 seconds)